


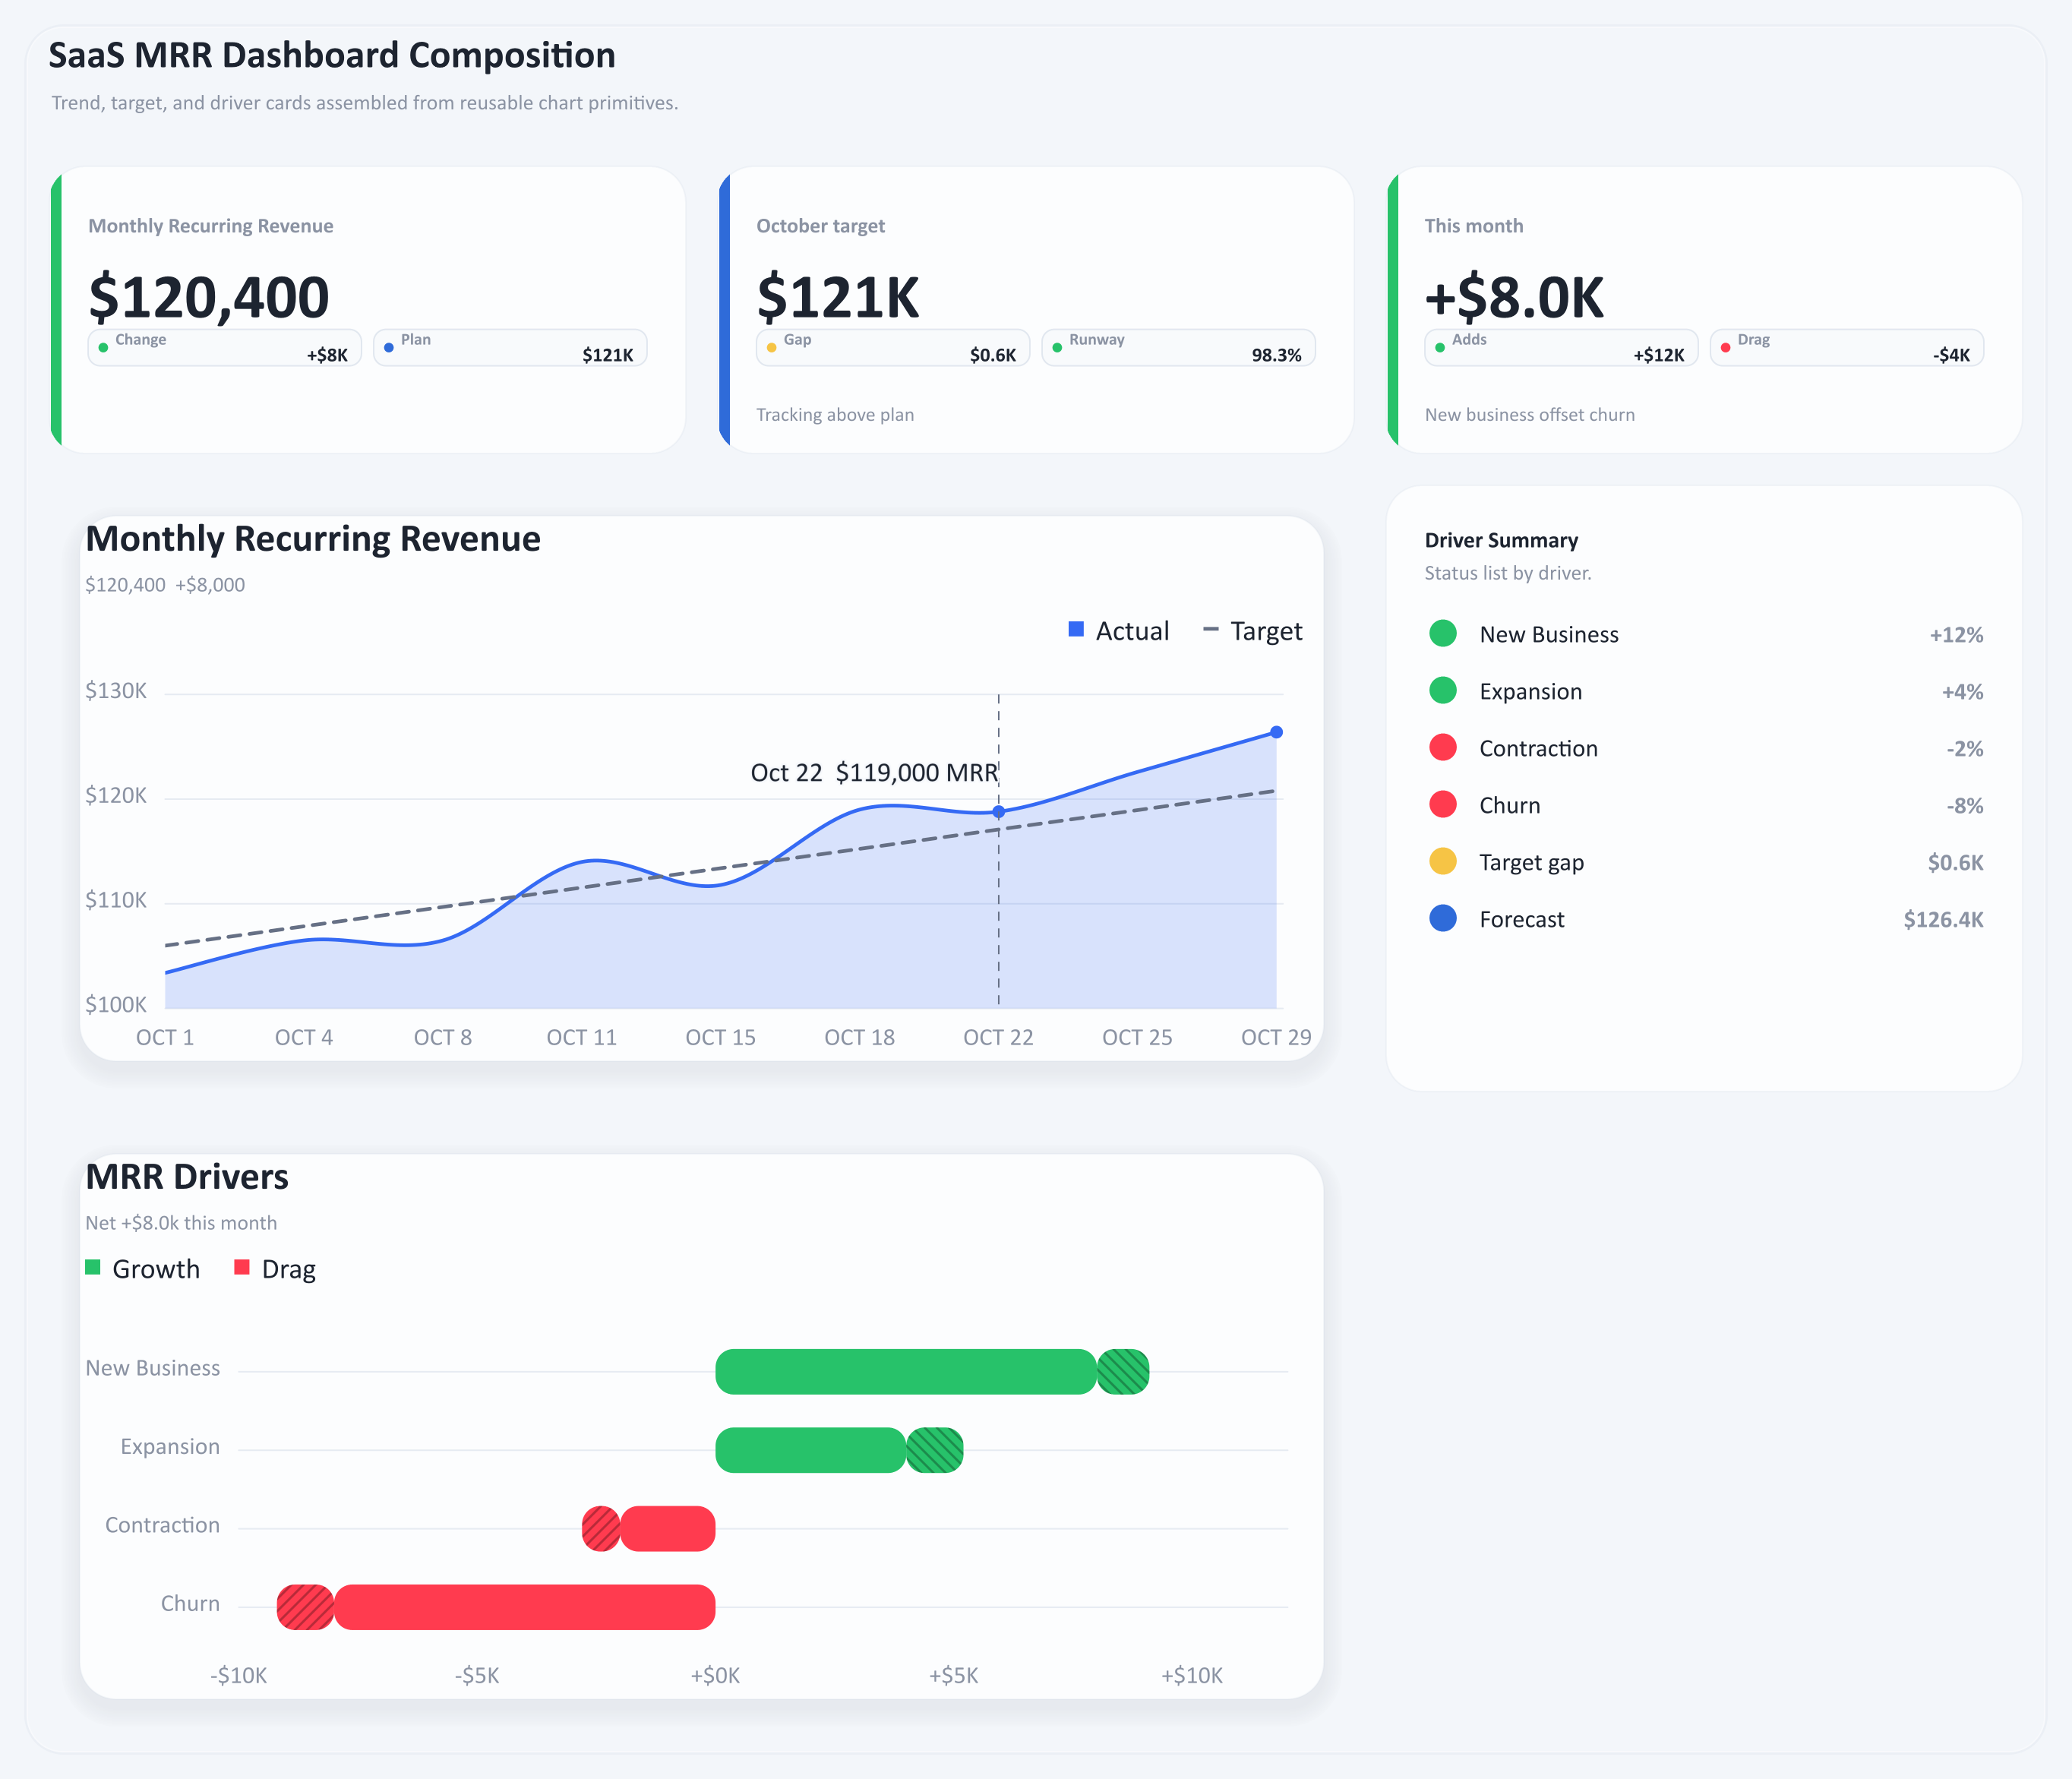
Charts rendered in .NET. Shipped to every surface.
Dashboards, charts, topology, maps and Mermaid diagrams from your data, written straight to SVG, PNG, HTML, email or Markdown. No browser, no JavaScript runtime and no package dependencies, from .NET or PowerShell.
- MIT licensed
- No runtime dependencies
- .NET Framework 4.7.2 to .NET 10
- Native AOT ready
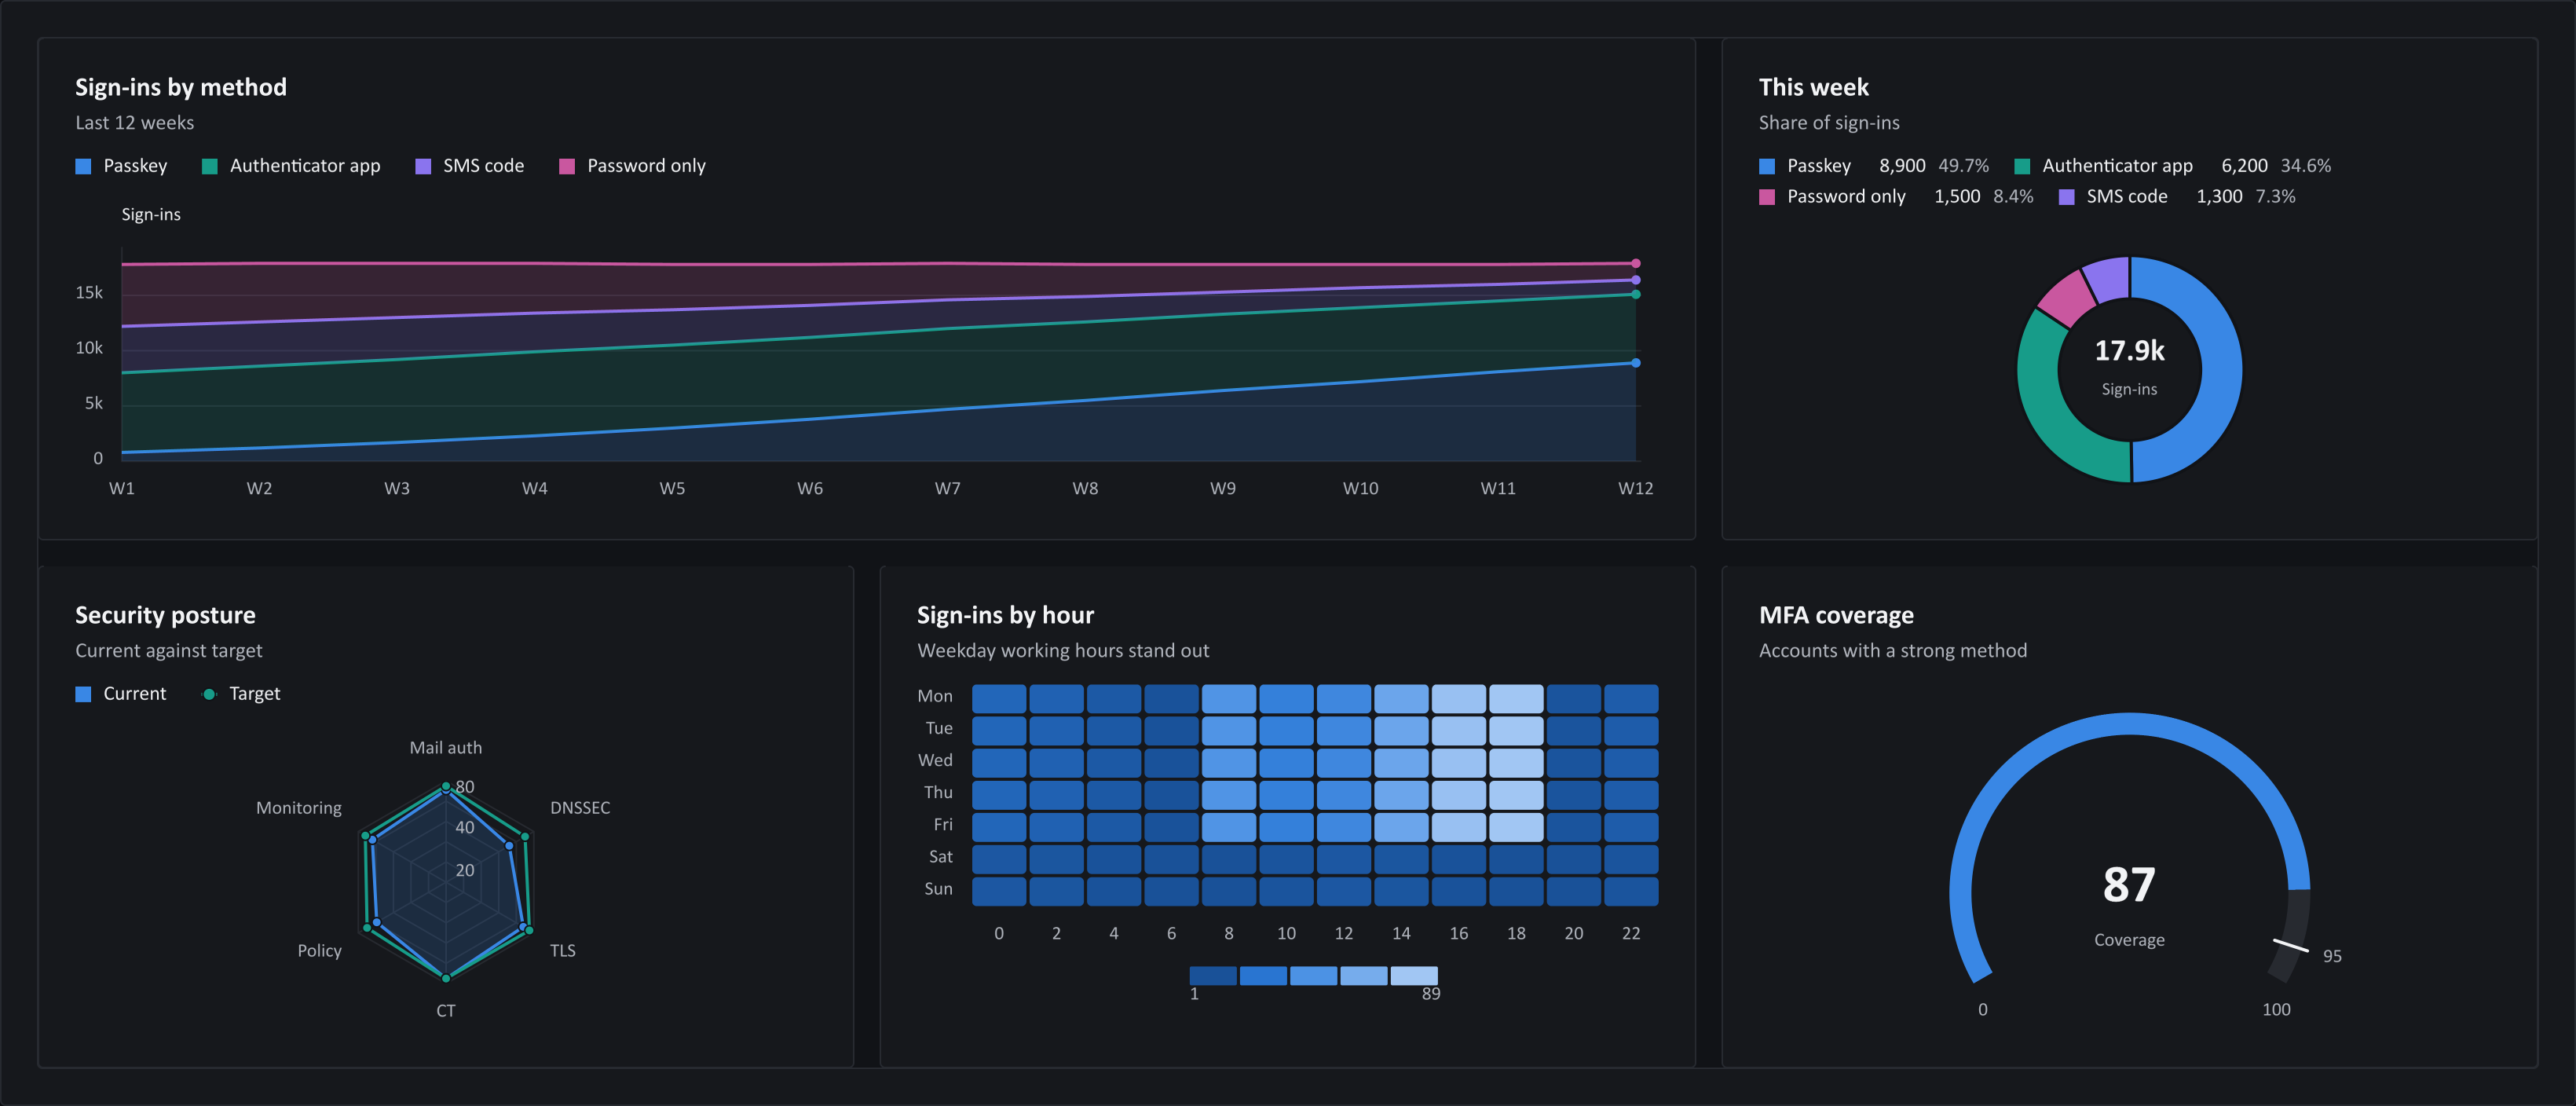
var report = ChartGrid.Create()
    .WithThemeMode(VisualThemeMode.Dark)
    .WithColumns(3)
    .Add(signIns, columnSpan: 2)
    .Add(methods).Add(posture)
    .Add(byHour).Add(coverage);

report.SavePng("identity-overview.png");New-ImageChart {
New-ImageChartDonut -Name 'Used' -Value 72
New-ImageChartDonut -Name 'Free' -Value 28
} -Theme Dark -FilePath usage.png60 chart examples. One renderer.
Bars to Sankey, calendars to word clouds, maps to org charts. Every tile is ChartForgeX output with matching light and dark themes and the C# that drew it.
Open the galleryOne definition, every surface
The same chart object writes vector SVG, native PNG, a script-free HTML page or an interactive one, an email-ready image and a Markdown fence. Switch the tabs; every file below was written by ChartForgeX.
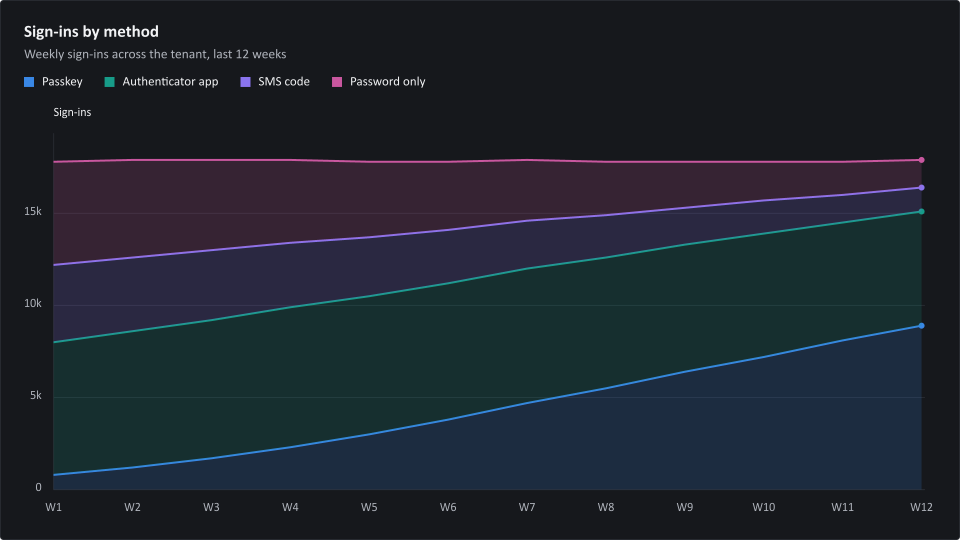
var chart = Chart.Create()
    .WithTitle("Sign-ins by method")
    .WithSubtitle("Weekly sign-ins across the tenant, last 12 weeks")
    .WithYAxis("Sign-ins")
    .WithXLabels(weeks)
    .AddStackedArea("Passkey", Points(800, 1200, 1700, /* … */ 8900))
    .AddStackedArea("Authenticator app", Points(7200, /* … */ 6200))
    .AddStackedArea("SMS code", Points(4200, /* … */ 1300))
    .AddStackedArea("Password only", Points(5600, /* … */ 1500));

chart.SaveSvg("sign-ins.svg");
chart.SavePng("sign-ins.png");
chart.SaveHtml("sign-ins.html");
- From
- Identity reports
- Subject
- Sign-ins this week: passkeys passed 8,900
Good morning. Passkey sign-ins grew again this week, and password-only sign-ins fell to 1,500.
```chartforgex chart v1 {#sign-ins title="Sign-ins by method" type="stackedArea" width=960 height=540}
subtitle "Weekly sign-ins across the tenant, last 12 weeks"
| Week | Passkey | Authenticator app | SMS code | Password only |
| --- | --- | --- | --- | --- |
| W1 | 800 | 7200 | 4200 | 5600 |
| W2 | 1200 | 7400 | 4000 | 5300 |
| W3 | 1700 | 7500 | 3800 | 4900 |
| W4 | 2300 | 7600 | 3500 | 4500 |
| W5 | 3000 | 7500 | 3200 | 4100 |
| W6 | 3800 | 7400 | 2900 | 3700 |
| W7 | 4700 | 7300 | 2600 | 3300 |
| W8 | 5500 | 7100 | 2300 | 2900 |
| W9 | 6400 | 6900 | 2000 | 2500 |
| W10 | 7200 | 6700 | 1800 | 2100 |
| W11 | 8100 | 6400 | 1500 | 1800 |
| W12 | 8900 | 6200 | 1300 | 1500 |
option yAxisTitle "Sign-ins"
```

The chart definition. Save it as SVG, PNG or HTML from the same object.
Vector output with an accessible name and description. Its colors are CSS custom properties, so this chart follows the page's theme switch. 50 KB
Native PNG from the same layout. No browser, no headless Chrome and no System.Drawing. 48 KB
A self-contained page with no script. Switch to interactive to see the optional ChartForgeX.Interactivity.Html adapter on the same chart. 50 KB
Mail clients get the PNG, with the chart's text alternative as its alt text.
The same chart authored as a fenced block. ChartForgeX.Markup parses it into the same chart model.
See it in action
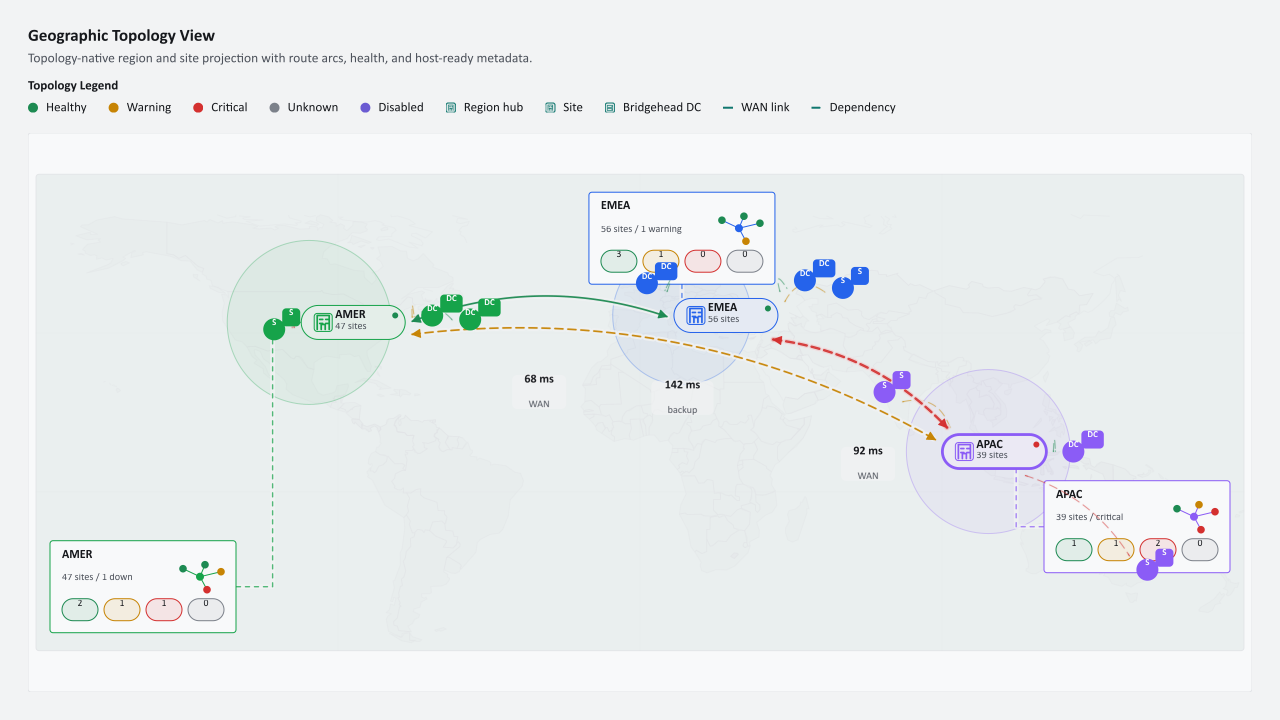
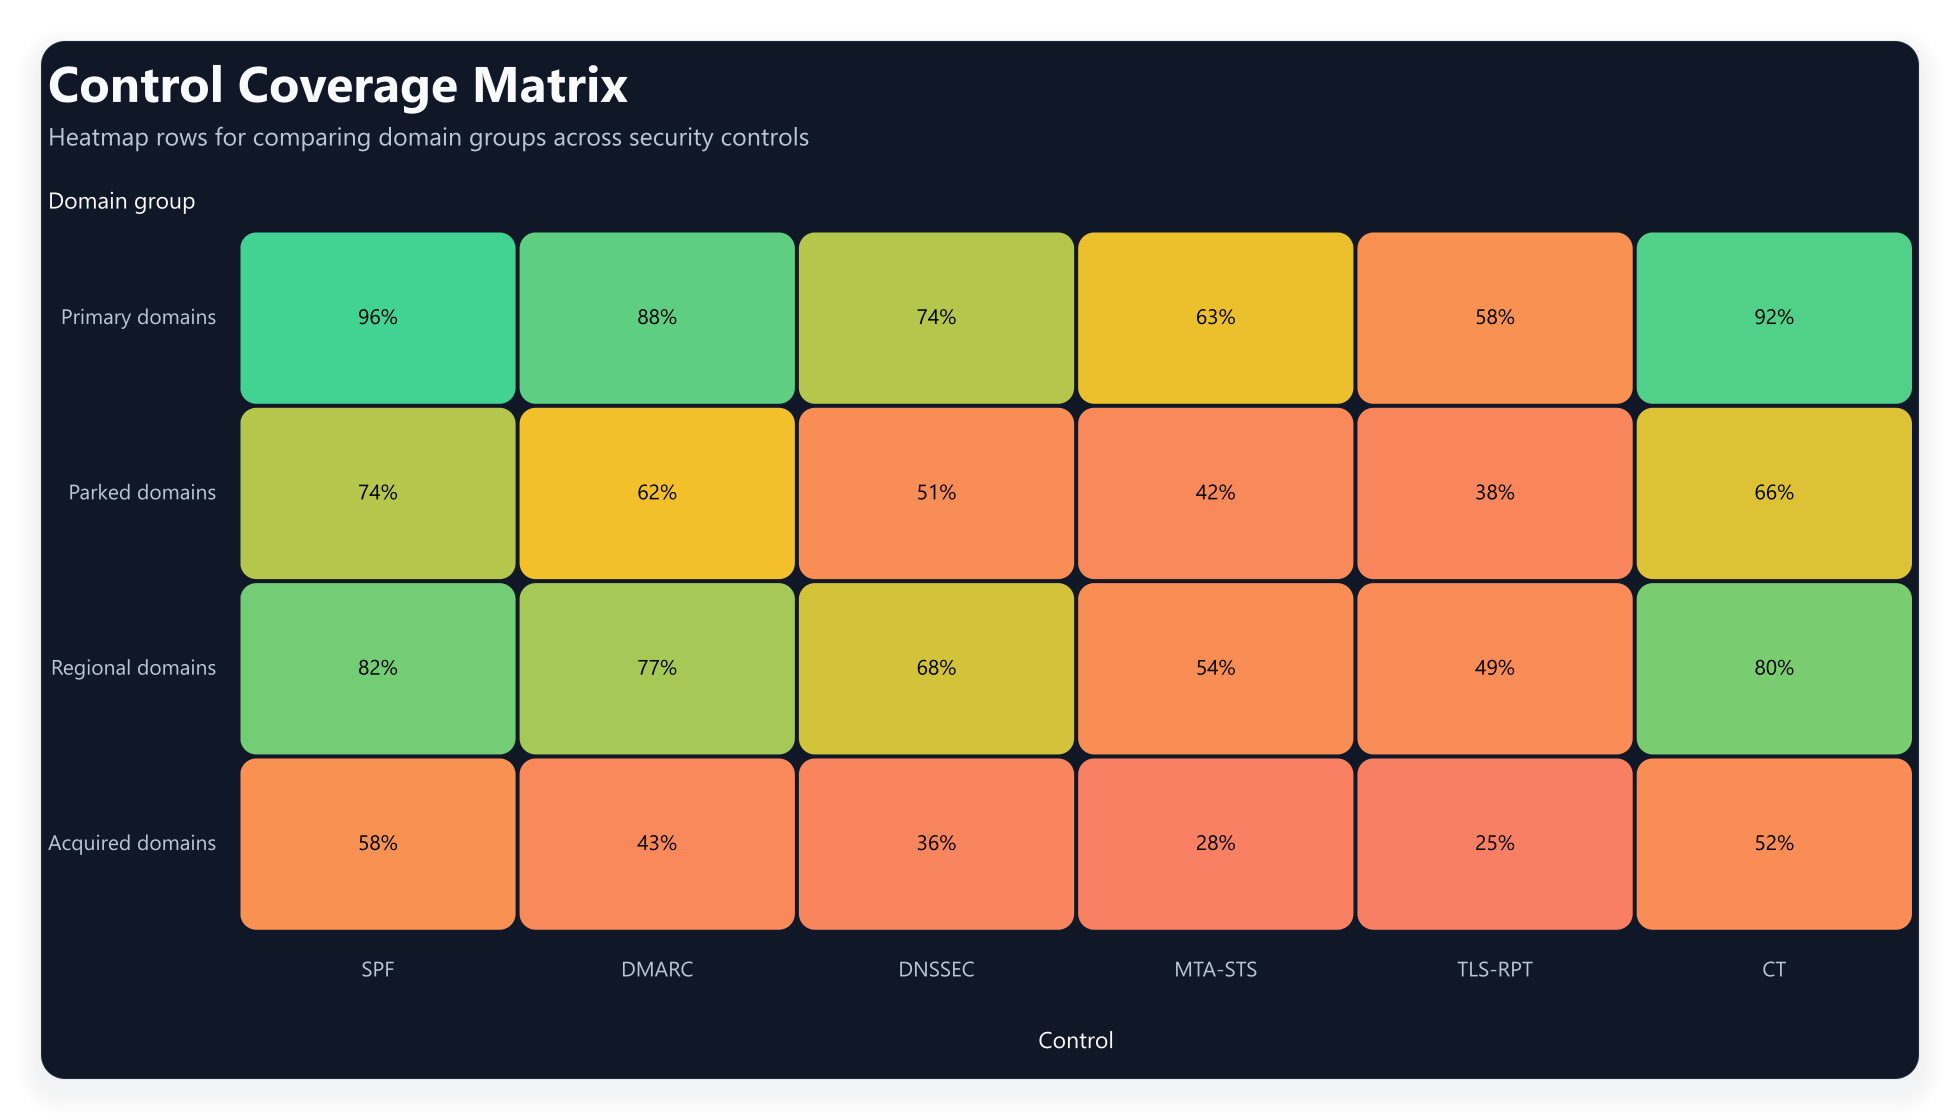
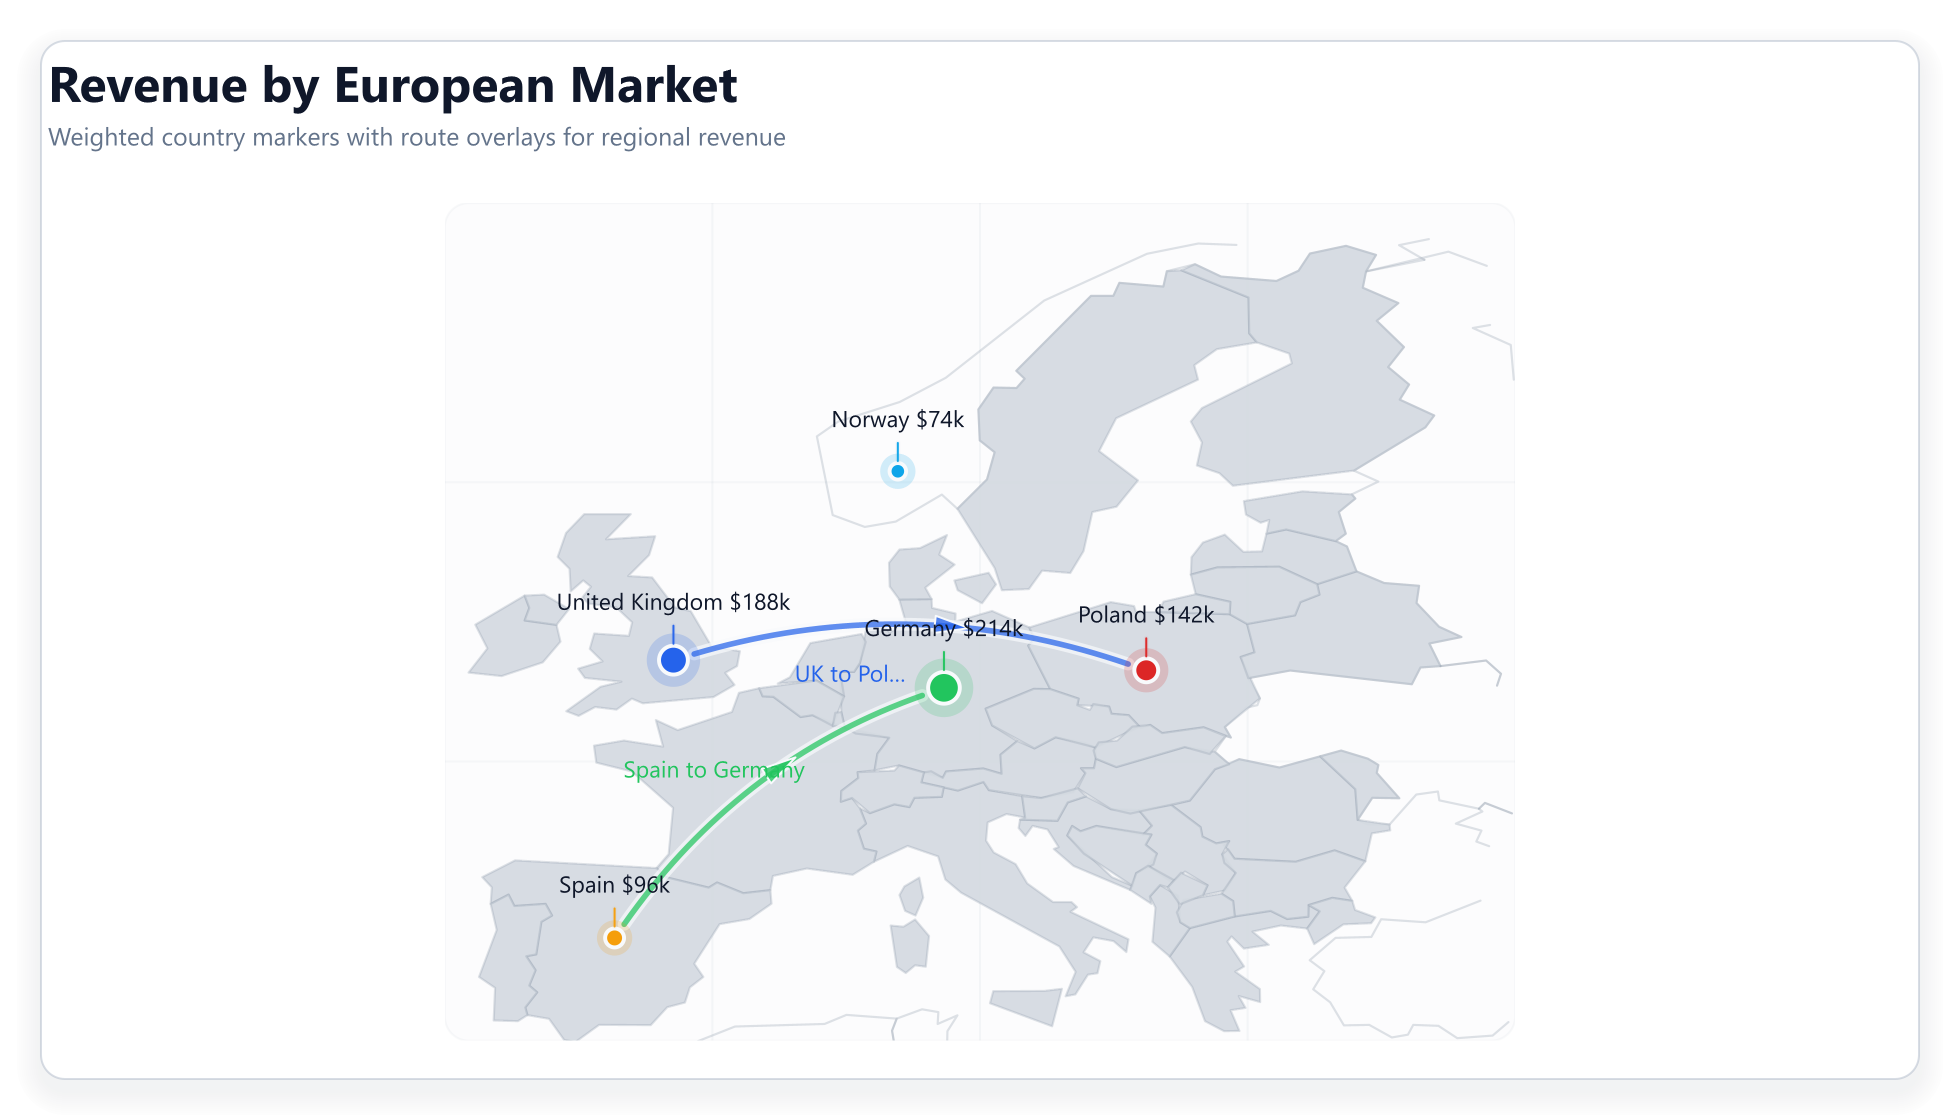
Report-ready dashboards, maps, matrices and flows from the examples project. Download the output or read the code that made it.
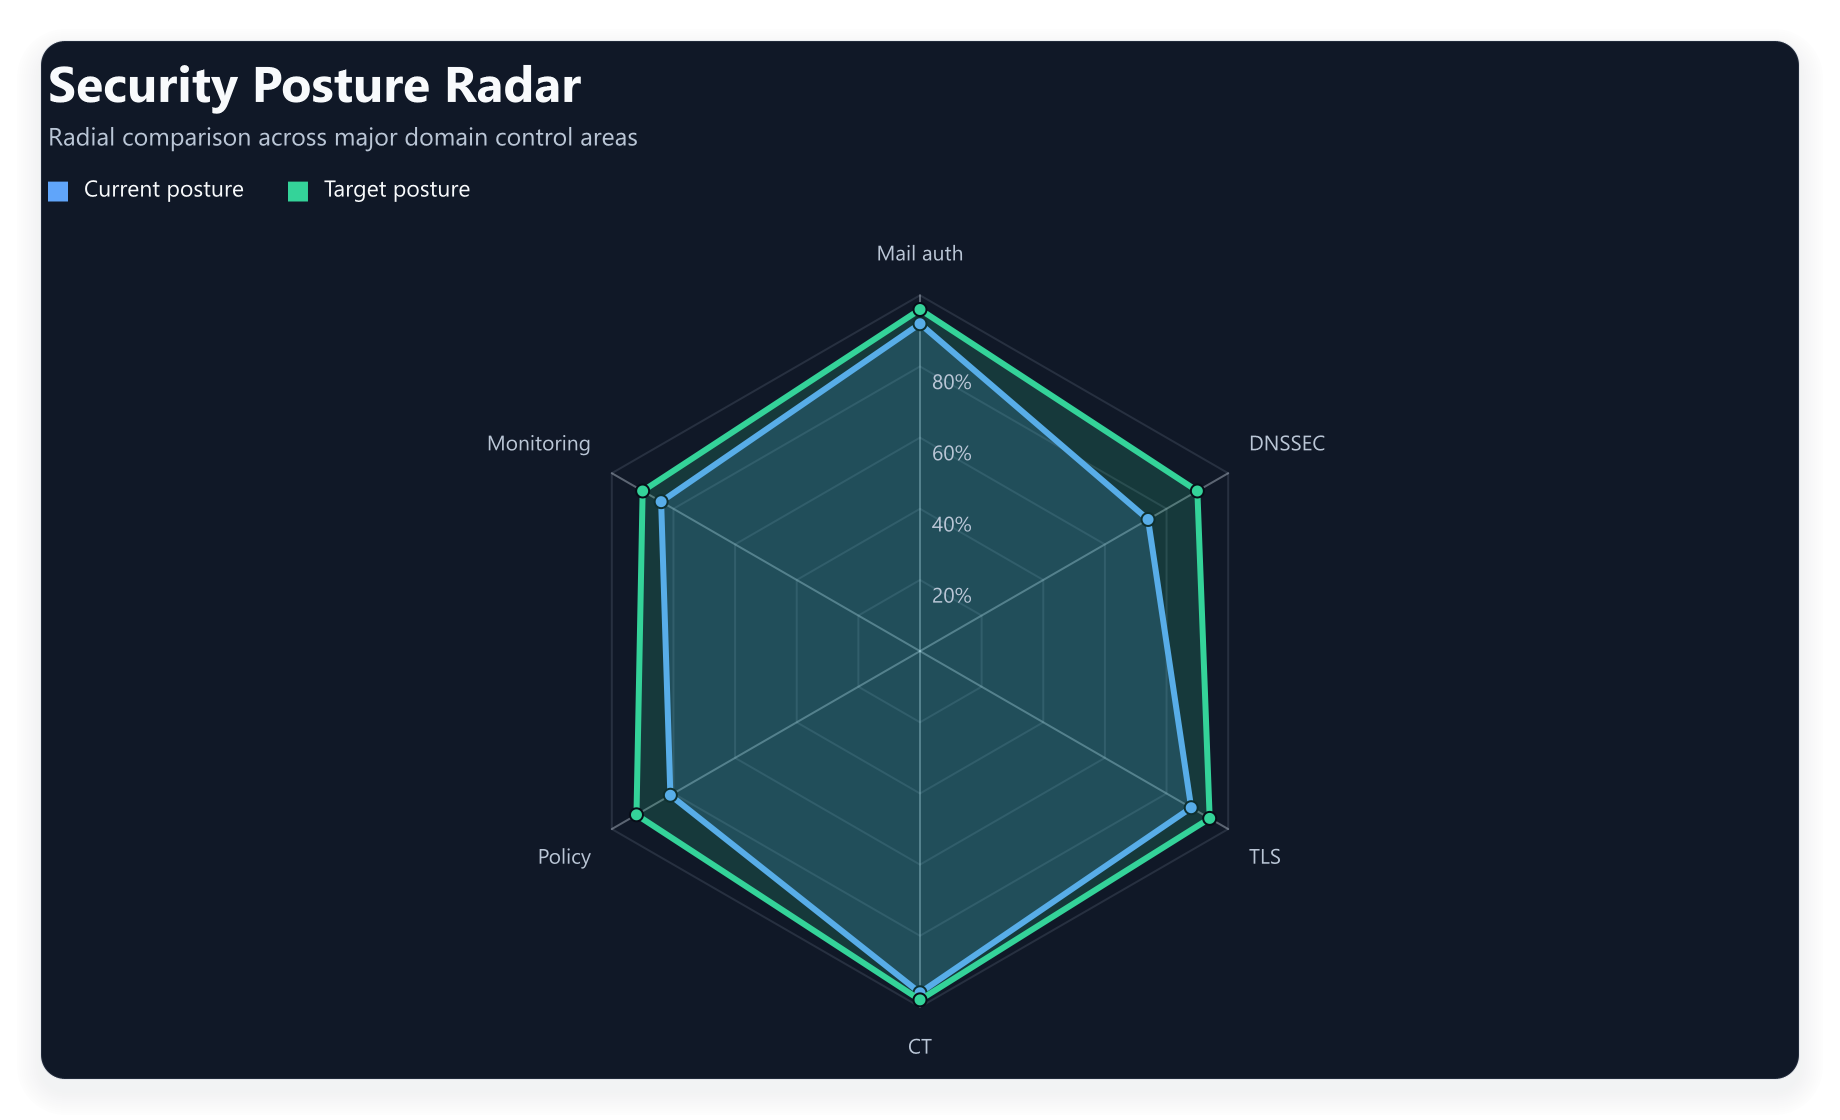
ChartForgeX in PowerShell
ImagePlayground is the Evotec PowerShell module for visual automation. It wraps ChartForgeX, so a script can turn the objects it already has into charts, service maps, dashboards, social cards and animated terminal stories.
- 34Charts
- 12Topology and org charts
- 10Dashboards and canvases
- 21Stories, motion and export
Install-Module -Name ImagePlayground -Scope CurrentUser Runnable scripts, shown with what they wrote


Mermaid diagrams without a browser
ChartForgeX.Mermaid parses Mermaid source and renders it through the native ChartForgeX engine, with no browser, no Node.js and no mermaid-cli.
Syntax support does not mean the same layout or pixels as Mermaid's browser renderer. Each diagram is drawn by ChartForgeX with your theme, and diagnostics tell you when source is kept without an exact visual interpretation.
gantt
  title Release train
  dateFormat YYYY-MM-DD
  section Engine
  Layout pass      :done,    l1, 2026-09-01, 12d
  Label placement  :active,  l2, after l1, 10d
  section Surfaces
  PNG parity       :         s1, 2026-09-10, 14d
  Email preview    :         s2, after s1, 7d

xychart-beta
  title "Tickets closed per sprint"
  x-axis [S1, S2, S3, S4, S5, S6, S7, S8]
  y-axis "Tickets" 0 --> 120
  bar [48, 61, 57, 72, 80, 77, 94, 103]
  line [48, 61, 57, 72, 80, 77, 94, 103]

sankey-beta
Office network,Passkey,5200
Office network,Authenticator app,3100
Remote,Passkey,3700
Remote,Authenticator app,3100
Remote,SMS code,1300
Remote,Password only,1500


Built for the places a browser can't reach
Browser chart libraries are excellent inside a web app. Reports, mail, documents and CI jobs need the picture before anyone opens a page.
| You need | ChartForgeX | Browser chart library | Mermaid.js |
|---|---|---|---|
| A chart in an email | PNG rendered in-process | Capture an image with a headless browser | Render with mermaid-cli, which drives a headless browser |
| A Word or PDF report | SVG or PNG, or editable Visio shapes through OfficeIMO | Capture an image first | Capture an image first |
| Snapshot tests in CI | Diff deterministic SVG text | Compare browser screenshots | Compare CLI renders |
| A static docs site | SVG with no runtime script | Ship a script bundle that draws on load | Ship the script or pre-render with the CLI |
| An interactive dashboard | Optional adapter for tooltips, selection and zoom | Their home ground | Click callbacks on some diagrams |
Install only what you render
Start with the core package. Add the others when a project needs canvases, animation, Mermaid, Markdown or browser interaction.
ChartForgeXCharts, chart grids, topology, maps, prepared scenes and still-image output.ChartForgeX.VisualsVisual canvases, image composition, KPI tiles, tables, lists and watermarks.ChartForgeX.StoriesAnimated visual and terminal stories with GIF and APNG output.ChartForgeX.MermaidParse Mermaid source and render it through the native engine.ChartForgeX.MarkupMarkdown fences for charts, timelines, topology, flows, sequences and tables.ChartForgeX.Interactivity.HtmlSelf-contained interactive pages: tooltips, topology explorer and graph explorer.
Works with the rest of the Evotec toolkit
- OfficeIMOPlace ChartForgeX visuals in Office documents, or project them as editable Visio shapes, through the OfficeIMO.ChartForgeX adapter.
- CanopyXInteractive trees and data grids for the tables that sit next to your charts.
- CodeGlyphXQR codes and barcodes in pure .NET, for report footers, labels and tickets.
- HtmlForgeXBuild HTML reports, dashboards and emails in C# around your charts.
- ImagePlaygroundPowerShell commands for charts, QR codes and image processing, built on ChartForgeX and CodeGlyphX.
Render your first chart in a minute
dotnet add package ChartForgeX